News You Can Use

A weekly round-up of the industry’s top stories and research curated by the ARF.

How the Ad Community’s Media Behaviors Became America’s “Norms”

via the VAB (Video Advertising Bureau and Research Now)

The goal was to investigate how the advertising community compares to the general public and explore their perceptions about ‘typical’ American media behavior. Research Now surveyed 254 respondents in February who were currently employed full time at a media, full service or digital / social agency or as a marketer / advertiser at a brand.

Respondents were asked to provide two separate responses to media consumption questions: “What do you do…” (self-reported) and “What do you think an average American does…” (estimated).

The survey compared the advertiser responses to the general population’s “real” media consumption based on third-party syndicated research. Among the key findings:

  • The average adult spends double the time watching TV than estimated by most media professionals
  • Media professionals vastly overestimated how much time is actually spent watching video on a computer and how much time is actually spent by the average adult watching video on mobile devices (adult viewing is overwhelmingly via TV sets)
  • There were other misconceptions about consumers’ use of connectivity, early adoption, ownership of connected TV’s (all overstated)

View the full report

Why research shows you’re better off with your existing ad campaign

The urge to ‘breathe new life’ into the brand with a new campaign can be hard to overcome. There’s a good reason agencies and advertisers should keep relying on the same campaigns, despite their strong desire to move on: the existing campaigns nearly always work better than anything new they can come up with.

We identified 109 new campaigns that were launched by our clients’ competitors, despite the fact that research results indicated the old campaign was still working. 74% of campaigns were replaced for no good reason.

The MAYA Rule (Most Advanced Yet Acceptable) asserts that people are most drawn to new things that are already familiar, rather than totally original. So if you want to breathe new life into a brand, building on what consumers already know and associate with it – while adding just enough newness to keep it fresh and engaging – works better than confronting them with something completely unfamiliar.

Jeri Smith. Why research shows you’re better with your existing ad campaign. July 10, 2010. The Drum.

What Does ‘Attribution’ Mean?

a commentary on modeling | via AdExchanger (source: Matt Voda – CEO at OptiMine)

Some believe attribution is all about identifying the magic sequence of ads and touch points that unlock the customer conversion. Others may define attribution as assigning a special weight to an ad based on a fractional formula. Throw in some murky terminology, such as “top-down,” “bottom-up” or “u-shaped,” and you can see how the topic can inspire confusion.

In some regards, this may just be a symptom of a nascent, emerging field. Market confusion precedes the coalescence and convergence around best practices, methodologies, and standardized terminology. Only after these key steps does a mature market begin to take shape.

On the methodology point, there is an overreliance in the market on the notion that the only way to achieve attribution is to track every customer across every device, for every ad in the mix. Not only is this impossible, it ignores the millions of reasons that have nothing to do with advertising that compel a customer to make a purchase.

Factors like hidden needs, personal beliefs, the power of the brand promise, the economy and even the day’s weather can all drive purchases in ways that are more impactful than ads. Missing these elements can cause harm by overassigning credit to an ad that may have had zero value or by undervaluing harder-to-track marketing efforts that boosted awareness or pre-purchase education.

Agile, action-oriented marketers may rush to certain attribution “answers,” but a dose of definition upfront is best in this case. Marketers should start with a more general definition of attribution that gets to the overall, essential goal: measuring the value of the impact or contribution a marketing campaign or an individual ad has on an outcome.

Read entire article on AdExchanger

What Low Response Rates Mean for Telephone Surveys

via Pew Research (A detailed report is available via the link below)

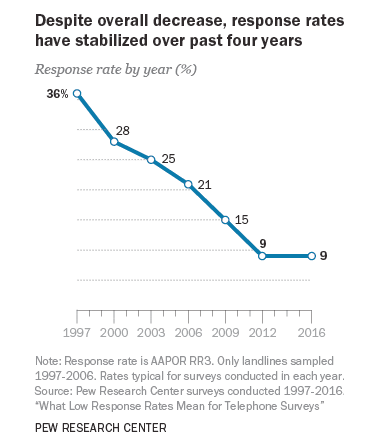
Telephone polls still provide accurate data on a wide range of social, demographic, and political variables, but some weaknesses persist. After decades of decline, the response rates for telephone polls like those conducted for Pew Research Center have stabilized in recent years to around 9% (see table below).

graph

Telephone poll estimates for party affiliation, political ideology, and religious affiliation continue to track well with estimates from high response rate surveys conducted in-person, e.g. General Social Survey. So even at low response rates, telephone surveys that include interviews via landlines and cellphones, and that are adjusted to match the demographic profile of the U.S., can produce accurate estimates for political attitudes.

The fact is that national polls (in 2016) were actually quite accurate. Collectively, they indicated that Clinton had about a 3 percentage point lead nationally and she ultimately won the popular vote by 2 points. Furthermore, according to a new report, there are clear reasons why national polls as a group fared better than state polls. For instance, national polls were much more likely than state polls to adjust for respondent education level in their weighting, which proved critically important in the 2016 election.

Live interviewer phone polls now represent a minority share of all polling conducted in the U.S. Online polls and automated (Interactive Voice Response) polls, or combinations of the two, are collectively more common and tend to have significantly lower response rates. Response rates to online opt-in surveys are so low as to be incomputable because far more internet users are invited to join opt-in survey panels (or to take one-off online surveys) than actually do so.

Read entire article on Pew Research

How Analytics Has Changed in the Last 10 Years (and How It’s Stayed the Same)

The change in analytics technologies has been rapid and broad. There’s no doubt that the current array of analytical technologies is more powerful and less expensive than the previous generation. It enables companies to store and analyze both far more data and many different types of it. Analyses and recommendations come much faster, approaching real time in many cases. In short, all analytical boats have risen.

With internet of things data becoming popular in many industries, analyzing data near the source will become increasingly important, particularly in remote geographies where telecommunications constraints might limit centralization of data.

These new tools are also more complex and in many cases require higher levels of expertise to work with. As analytics has grown in importance over the last decade, the commitments that organizations must make to excel with it have also grown. Because so many companies have realized that analytics are critical to their business success, new technologies haven’t necessarily made it easier to become — and remain — an analytical competitor. Using state-of-the-art analytical technologies is a prerequisite for success, but their widespread availability puts an increasing premium on nontechnical factors like analytical leadership, culture, and strategy.

Thomas H. Davenport. How Analytics Has Changed in the Last 10 Years (and How It’s Stayed the Same). June 22, 2017. The Harvard Business Review.

Message from the new ARF CRO Paul Donato

I am really excited to be joining the ARF at this critical moment in our industry. In the last several years I have been working with new forms of data, techniques and problems to solve. I hope these experience help to bring value to our members’ experience and the insights they derive from membership.

It is a great privilege and fantastic opportunity to serve as Chief Research Officer for the ARF. This organization has an incredible history of accomplishment and service. I look forward to working with the ARF team in this role to tackle some of the critical issues facing advertising today.

We are standing in the center of the industry at a time when it needs science and insights now more than ever. From cross-platform to omnichannel, we face increasingly complex decisions that would have been unimaginable just a few years ago. The industry needs a strong scientific and independent partner with the depth of the ARF to guide it through these complex decisions.

To help navigate this complexity, the ARF is developing and curating content for our members, that addresses comparability of consumer and media metrics, research quality, and 21st century data, analytics, and technology.

We are conducting critical original research to guide ARF members through the use of the many new methods and the meaning of the numerous new data sets that we’re constantly seeing.

The ARF is collaborating with other industry organizations to define scientifically based standards, and continues to be the standard-bearer of measurement and research.

Can anyone doubt this is the most exciting moment in our industry? I don’t!

I look forward to working with you, through our councils, conferences, and in-person.

To read the complete article, click to visit theARF.org.

Top 10 Burning Issues in Digital via comScore

What fascinated us in looking back at this content was the realization of just how different the issues today are versus just a few years ago. That’s how fast the digital media industry changes, where the most pressing concerns of yesteryear have either been solved, faded into the background, or simply been overtaken by more significant issues.

If there’s a single common thread through most of this year’s themes, it is the power of digital data to drive quality. The world today looks very different than even a few years ago because of the large datasets now underlying all of measurement. Data scale brings with it a host of new challenges and increasing complexity, but at the same time offers new ways of solving previously intractable challenges. Large datasets allow us to leverage data science methods to eliminate waste, improve methodological approaches, slice and dice data more finely, and combine disparate datasets to drive new value.

  1. Bridging the Divide Between TV & Digital
  2. Advanced Audience Data
  3. Monetizing Mobile
  4. Measuring Unduplicated Reach
  5. Cross-Device Marketing
  6. Programmatic Pressure on CPMs
  7. Moving Beyond Viewability
  8. Filtering Big Botnets
  9. The Value of Attention
  10. Advertising Attribution

Andrew Lipsman. Top 10 Burning Issues in Digital. comScore.

To read the complete article and download the white paper,
click to visit comScore.

The Power of OTT: Audiences & Engagement – Report by FreeWheel

The Interactive Advertising Bureau (IAB) defines OTT as: A device that can connect to a TV (or functionality within the TV itself) to facilitate the delivery of internet-based video content. According to eMarketer, over 58% of the US population uses an OTT device at least once a month.

A new FreeWheel report divides these devices into three groups;

  • Attached Devices (84% of all Ad Views): Devices that plug into or pair with a television set to stream digital content. These devices are mainly used for digital content consumption. Examples: Apple TV, Chrost, Roku and Amazon Fire TV
  • Gaming Consoles (11% of all Ad Views): Devices that include home video game systems that also have built-in entertainment platforms and apps. Examples: PlayStation, Xbox and Wii. Video gaming typically drivhe purchase of these devices, but many owners are increasingly using these devices for video streaming.
  • Smart TVs (5% of all Ad views): Internet-enabled television sets that have the ability to receive traditional linear feeds as well as stream on-demand content without any additional devices.

The Freewheel Report covers several of features of OTT platforms for marketers including these two:

  • OTT allows marketers to reach viewers who are harder to find on traditional TV, including affluent millennials and cord-cutters. The median OTT viewer is 23 years younger than TV viewers and yearly median housd income is nearly $10,000 higher than traditional TV households (based on Nielsen DAR measurement of audience composition by show on desktop and mobile devices, extrapolated to OTT based on the show mix of Oevices).
  • OTT is likely to result in higher levels of ad exposure compared to other platforms. Viewers on OTT devices can’t switch to another tab when an ad plays or easily change the channel during commercial breaks. As a result, OTT’s average video ad completion rate is a whopping 98%.

Finally, FreeWheel points out that traditional TV and digital measurement solutions were not designed to incorporate OTT viewing and that the industry has yet to arrive at a common standard for how to evaluate campaign reach, targeting, and performance. There are many ways to get credit for audiences on OTT — but all of them take work and require flexibility from buyers. This new analysis suggests that making the extra effort is worth it

To read the complete article, click to visit Freewheel.

Register now to attend the ARF’s OTT event on October 3, 2017, OTT: Is TV by any other name still TV?

MEC: Identifying purchase ‘pre-triggers’ drives results

Marketers habitually target advertising at people who are in the market for a product or service but understanding the “pre-triggers” that got them to that point may be a more effective way to create communications.

Media agency MEC’s analysis of over 250,000 individual purchase journeys across thirty-six categories has identified four stages, from the initial passive stage, when people aren’t consciously thinking about a purchase through the second, trigger stage, when a need or want brings people into the third, active stage, when they are thinking about their potential purchase; then finally, the purchase moment.

There are several reasons why it has become increasingly challenging and expensive for brands to influence decisions in the active stage, they contend, including the fact that few people buy a brand that wasn’t on their consideration list when they entered the market; that the size of consideration sets in any case has remained steady even as the choices on offer have exploded in number; and that the cost of media targeting people in the active stage has been growing significantly.

All these factors lead the authors to advise marketers to use data signals to identify and exploit pre-triggers – “the actions people take just before they are triggered into the market” – and so establish their brands in consideration sets at the optimum moment just before the trigger to the active stage.

By Pete Buckley (Head of Strategy) and Richard Bradford (Group Strategy Director), MEC UK writing in the current issue of Admap.

WARC members can sign-in to access the full report from the July/August Issue of Admap.

ANA’s Latest Initiative: Elevating Multicultural Marketing

Charter members of the Association of National Advertisers’ (ANA) Alliance for Inclusive and Multicultural Marketing (AIMM) recently met in New York for the first all-committee gathering. A who’s who of CMOs and senior-level marketers, AIMM has also brought agency, media and trade association leadership to the table, many with specializations in black, Hispanic, Asian and LGBTQ marketing, myself among them.

ANA CEO Bob Liodice didn’t sugar coat the situation as he kicked off the meeting. “We’re failing,” he said, referring to sluggish sales and anemic business growth industry-wide. But then he pointed to multicultural marketing as an under-used source of brand health. “Multicultural marketing needs to be strongly considered as part of a comprehensive growth strategy,” he said.

Cultural targeting is central to the work of the Case for Change committee, led by co-chairs Nydia Sahagun, SVP segment marketing at Wells Fargo, and Manoj Raghunandanan, VP of global brand management at Johnson & Johnson. Their analysis suggests that years of oversimplification have set multicultural marketing back, contributing to intellectual interest but enabling action apathy.

AIMM co-founder and researcher Carlos Santiago has been working closely with the Metrics and Measurement Committee to address concerns identified in an AIMM benchmark study. “Without equally accurate data, it is nearly impossible to distinguish segment-specific performance from that of general market audiences.” He added that “blurred attribution tends to artificially decrease multicultural ROI and inflate the non-Hispanic-white contribution.”

Rochelle Newman-Carrasco is Chief Hispanic Marketing Strategist at Walton Isaacson.

Rochelle Newman-Carrasco. ANA’s Latest Initiative: Elevating Multicultural Marketing. AdAge

To read the complete article, click to visit AdAge.