This case study offers an in-depth comparison and analysis of ChatGPT 4, Bard, and Claude AI in the context of coding open-ended survey questions. Using a recent survey question administered among 23 research companies that measure attention,4 we first conducted thematic analysis and then created scatter plots to display the relationship between variables. The analysis provides valuable insights into the capabilities and limitations of these AI systems compared to human intelligence and offers guidance on effectively employing them in research and data analysis tasks.
Thematic Analysis
The prompt:
Human analysis
- Attention as a function of Visual Response: Fixations can be regarded as the most granular elements of the attention stream. Companies may analyze gaze durations, reach, fixation intensity, and sequences.
- Attention as a Biometric Response: Such as heart rate variability or skin conductance. Reflects immersion, which is a measure of emotional connection and attention.
- Attention as a Neurological Response: Such as EEG. A comprehensive analysis of how consumers engage with information would be incomplete without considering emotion and memory in conjunction with attention.
- Attention as a Digital Response: Use observed data and combine it with tracking pixel data to train models that can predict human attention in-flight and at the point of transaction such as tracking pixels.
- The Absence of Attention: In layman’s terms, inattention reflects not noticing something.
ChatGPT 4
- Attention as a measure of emotional connection and engagement: Several companies emphasize the emotional aspect of attention and view it as a measure of how engaged and involved individuals are with the content or stimulus.
- Attention as a cognitive process: Companies view attention as a cognitive process that involves the allocation of limited cognitive resources to process stimuli. They often highlight the different types and aspects of attention, such as sustained attention, orienting, top-down vs. bottom-up attention, etc.
- Attention as a proxy for outcomes: Some companies view attention as a proxy measurement for different outcomes, such as engagement, campaign effectiveness, and impression quality. They often incorporate multiple signals, such as visibility, situation, interaction, and physiological responses, to capture attention.
- Attention as a measure of awareness and sensory processing: Companies focus on attention as a measure of physical or mental orientation towards a stimulus, sensory processing, and presence in the viewing environment.
Bard
- Segment 1: Focus and Prioritization
Audacy: Immersion
MediaScience: Automatic or controlled focusing of limited cognitive resources
Amplified Intelligence Technologies: When a human stops what they are doing, ignores other things around them, even if for a fleeting moment, to understand or learn something - Segment 2: Mental Engagement and Processing
Eye square: Meaningful attention
NIQ-BASES: Mental prioritization of information
Affectiva: Engagement
Chilmark Digital: Power of content to stimulate individuals’ ability and desire to process and respond - Segment 3: Sensory Processing and Awareness
Affectiva: Passive Attention
Realeyes: Awareness to a stimuli while ignoring other stimuli - Segment 4: Measurement and Quantification
eye square: Fixations, gaze durations, reach, fixation intensity, sequences
TVision: Person-level measure of attention at a second-by-second granularity
DoubleVerify: DV Authentic Attention Æ
Integral Ad Science: Visibility, Situation, and Interaction
Element Human: Visual orientation to the object of interest
MESH Experience: Experience Noticeability
Claude AI
- Attention as orientation/focusing of mental resources or senses towards a stimulus
- Attention as awareness and conscious processing of a stimulus
- Attention as a threshold for further information processing and memory encoding
- Attention tied to emotional engagement and arousal
- Attention as a predictor of downstream outcomes like ad recall and sales
- Distinctions made between passive attention/exposure vs active attention/engagement
Many companies mention the multidimensional nature of attention and that it involves both conscious/controlled and unconscious/automatic processes. Some also note the imperfection of attention as a metric and that it needs to be considered in conjunction with other metrics like emotion to get a full picture.
I don’t have a strong assessment of which definition is “best” – they all provide value depending on the specific context and use case. But analyzing the different perspectives is helpful for me to better understand the nuances of how attention is viewed in the industry. Please feel free to provide any other sample data or clarify any of the definitions further. I’m happy to continue synthesizing and discussing how attention is characterized across different sources.
Following prompt:
Response:
- Orientation Attention as the orientation of mental resources or sensory faculties towards a particular stimulus.
- Awareness Attention as conscious awareness and active processing of a stimulus.
- Threshold Attention as reaching a threshold of processing that enables encoding into memory and downstream impacts.
- Engagement Attention that reflects emotional, motivational, or behavioral engagement with a stimulus.
While different terms were used to describe each feature of attention, most of the themes identified by all three LLMs could be mapped into a theme identified during the human analysis:
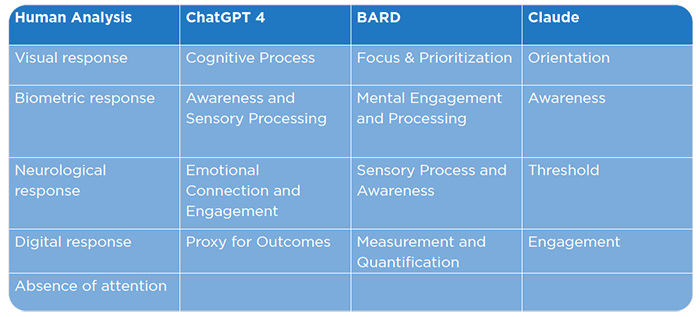
Notably, human analysis predominantly focused on identifying differences in methodologies, in contrast to AI analysis which delved into broader conceptual aspects.
Upon reflection, AI analysis emerges as more insightful, capturing wider conceptual themes, while the human analysis seems more aligned with a systematic sorting of techniques, ironically akin to what one might expect from a computer’s approach.
Scatter Plots:
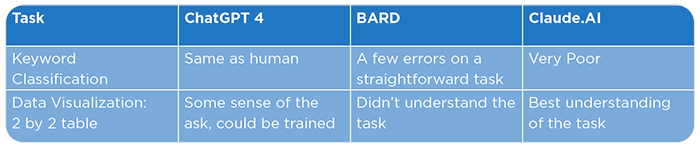
A scatter plot is a type of data visualization used to display the relationship between two numerical variables. We wanted to see if each of the models were capable of doing at least a simple plot, that is, placing companies correctly on a two-by-two table. Upon visually examining the output of the three models, it appears that only ChatGPT 4 would categorize company missions in alignment with human analysis, specifically focusing on the words “attention” and “emotion”. None of the models were capable of accurately performing data visualization, a task outside the typical strengths of Large Language Models (LLMs). However, with substantial training and integration of their APIs into a system, it’s plausible that these models could contribute to data visualization systems in the future.
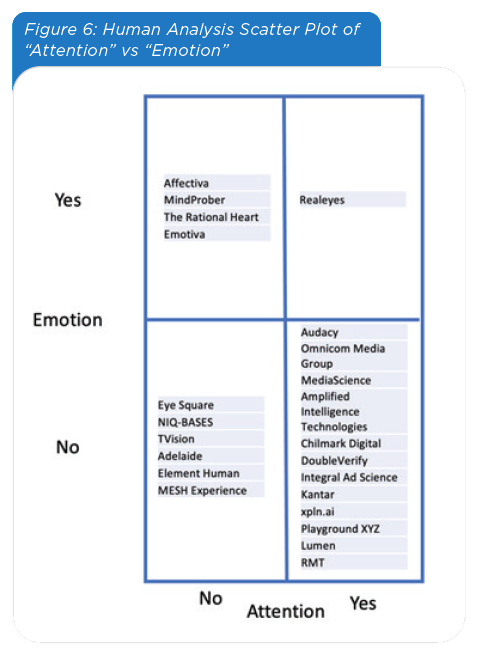
Human Analysis
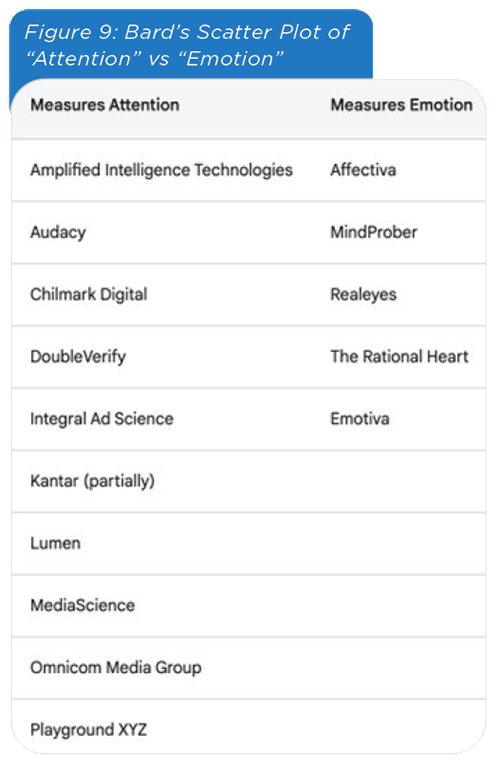
In reviewing the mission statements of various companies, we categorized them based on their references to “attention” and/or “emotion” (see Figure 6). The majority claimed to study attention, while a smaller number indicated they measure emotion. This classification was strictly based on the presence of these specific terms in their mission statements.
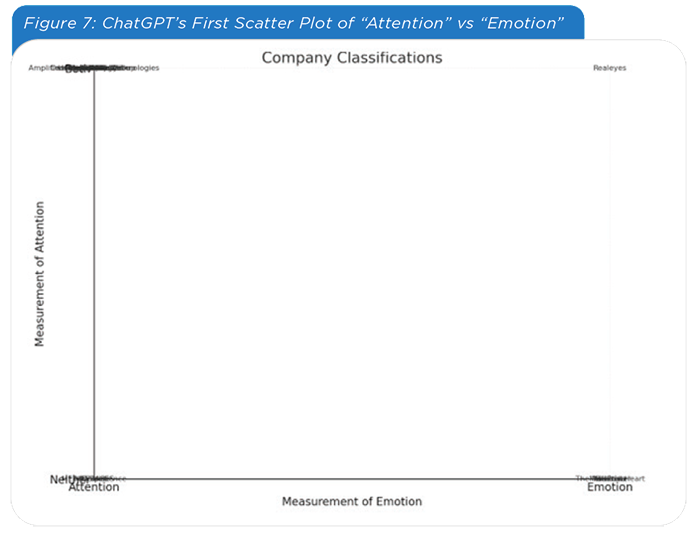
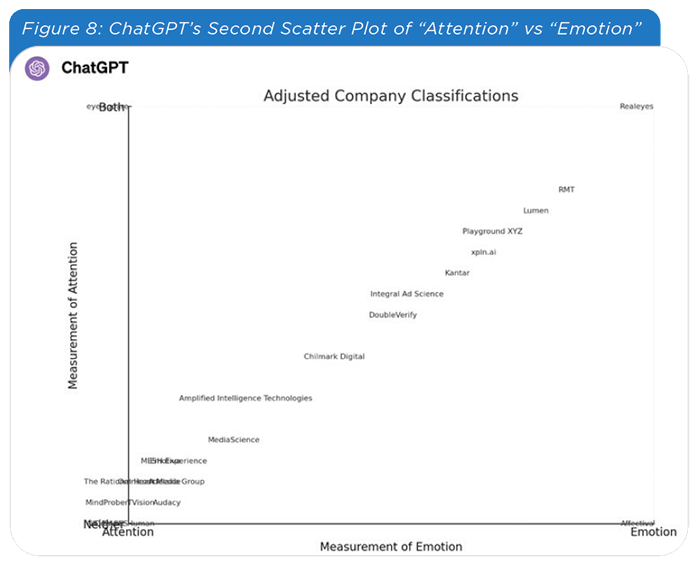
ChatGPT 4
- Classification: ChatGPT 4 successfully classified companies according to their mission statements, focusing on whether they mentioned “attention” or “emotion”.
- Data Visualization: ChatGPT 4 struggled with data visualization, showing limitations in this aspect.
- Adaptability: It adapted to prompts for reclassification and improved in plotting companies in a 2×2 table, but still faced challenges in data visualization.
Bard
- Misclassification: Bard classified four out of 23 companies differently than ChatGPT 4 or human analysis. For example, Realeyes was classified under “Emotion” despite mentioning “attention” in its mission.
- Data Visualization: Bard was not effective in data visualization, with labels not properly placed in the correct columns. Bard can create a data visualization if receives a CVS file of data. Still, it’s output is less satisfactory than ChatGPT 4’s.
- Interpretation Variability: Bard’s classification may reflect its interpretation of the mission statements, implying measurement of both “attention” and “emotion” even when not explicitly mentioned.
Claude AI
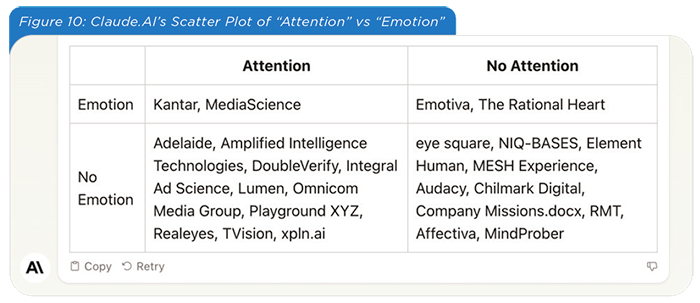
- Unusual Classification: Claude AI misclassified half of the companies when given the same prompt as the other models.
- Data Visualization: Although its classifications were incorrect, Claude AI successfully created a proper 2×2 table.
- Prompt Specificity: Claude AI did not improve in classifications even with prompts focused explicitly on the keywords “attention” and “emotion”.
Key Takeaways:
All three LLMs responded with classifications that were more conceptual than the human classification which was more based on methods of measuring attention. It is worth clarifying that this study fundamentally was to evaluate the differences in methodology among the companies that measure attention. Hence, human classification might be biased by that objective. That said, if we ignore the purpose of the study, the LLMs may have done a better job of classifying the responses.
Only Claude AI did a reasonable and usable job of visually classifying the responses.
For a more detailed review of the prompts and LLM responses, see.
4 The question was: How does your company define attention?